ETS, makers of the GRE Test, just published their 2022 A Snapshot of the Individuals Who Took the GRE General Test, a comprehensive report of key GRE statistics. This report is a deep dive into the volume and performance information for test takers who took the GRE General Test between July 1, 2017, and June 30, 2022; including the backgrounds of test takers and the factors that affected their GRE performance. Hopefully this will help you find the GRE test score range that will benefit your application.
This post is a snapshot of the GRE snapshot — we take a look at the key GRE statistics on gender, age, US citizenship, ethnic group, region, and whether they’re taking the GRE for MBA admissions. Let’s dig in!
ETS looked at the records of test takers who took the GRE General Exam within the period from July 1, 2017 to June 30, 2022. This is broken up in the data below into the following five periods:
The most recent scores were used in the event that test takers had more than one set of scores for the GRE General Test.
The data includes both on-site and at-home testing options starting in the 2020-2021 year, when the option was introduced in response to the COVID-19 pandemic.
341,574 people took the GRE Test between July 1, 2021 and June 30, 2022. This is a 6.8% decrease from 2020 – 2021.
Key GRE Statistics from the 2022 ETS GRE Snapshot Report, Achievable
ETS does want to be clear: the data in this report is not representative of the population planning to attend graduate school, nor of the characteristics and performance of students presently enrolled in graduate schools. It is just a snapshot of GRE test takers specifically.
These figures are presented without bias or opinion. Furthermore, the ETS has flagged that errors of measurement may occur as part of the standard process of evaluating a large and imperfect data set. Think of the data below as guides in your own GRE pursuits, and not an evaluation of any group.
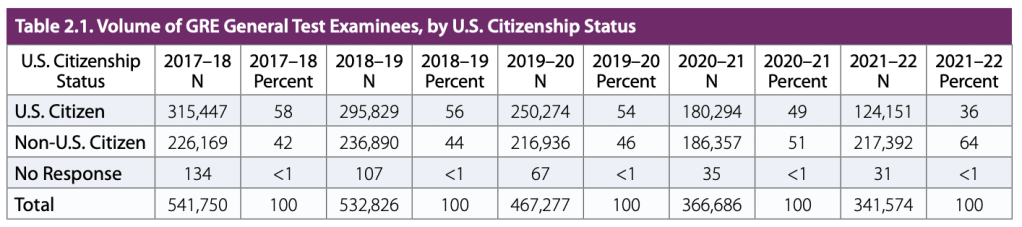
341,574 people took the GRE Test between July 1, 2021 and June 30, 2022. This is a 6.8% decrease from 2020 – 2021, and seems to have slowed the aggressive decline in test takers during the years impacted by the COVID-19 pandemic.
GRE test takers that were US Citizens declined by 31% from 180,294 to 124,151 between 2020-21 and 2021-22.
Key GRE Statistics from the 2022 ETS GRE Snapshot Report, Achievable
However, when you look at the chart above, you can see clearly that there’s a very different story for US Citizens versus non-US citizens. GRE test takers that were US Citizens declined by 31% from 180,294 to 124,151 between 2020-21 and 2021-22. This decline was offset by a gain in Non-US Citizen GRE test takers of 16.6% from 186,357 to 217,392. After 2020-21 was the first year that Non-US Citizen test takers overtook US Citizen GRE test takers, the trend continued and the gap widened substantially. There are now 75% more GRE test takers outside of the US than in it.
India has almost overtaken the US in total GRE test takers, with 114,647 in 2022 to the United States’ 124,151.
Key GRE Statistics from the 2022 ETS GRE Snapshot Report, Achievable
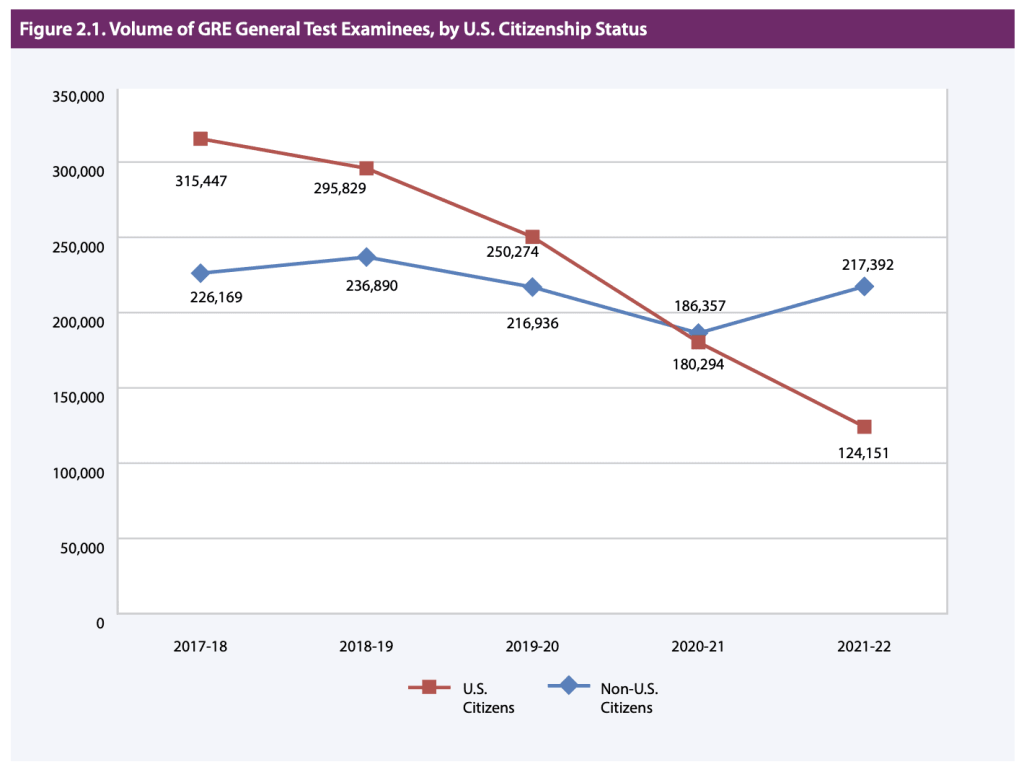
In the US, White was the largest group of GRE test takers, representing 53% of the total. The next largest ethnic group was Asian, at 9%, and then Black at 7%. If you combine Mexican, Puerto Rican, and Other Hispanic, as ETS does in the following chart, Hispanics are the largest non-white ethnic group of GRE test takers in the US with 12,674 students, or a little over 10% of the total.
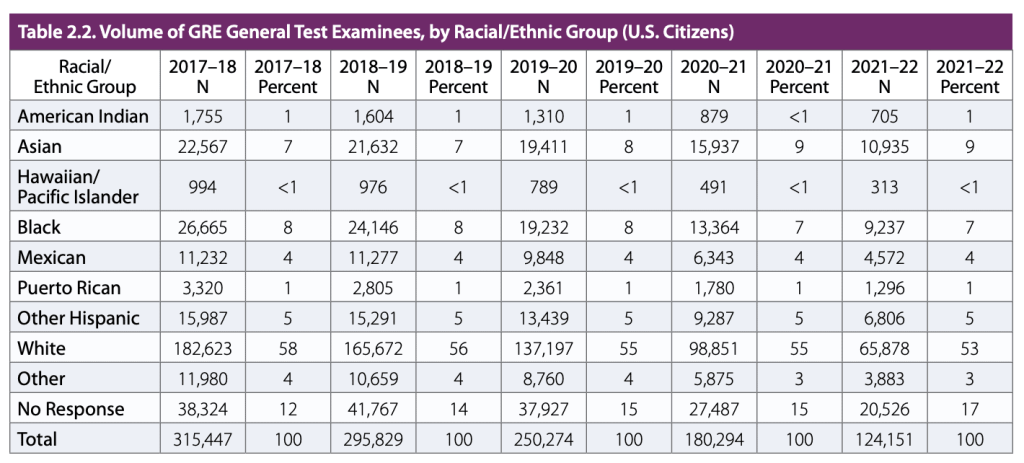
When you remove the largest White ethnic group, you can see that the decline in US GRE test takers was consistent across all remaining ethnic groups. The lone exception is Asian test takers, who as a group declined more slowly than the others.
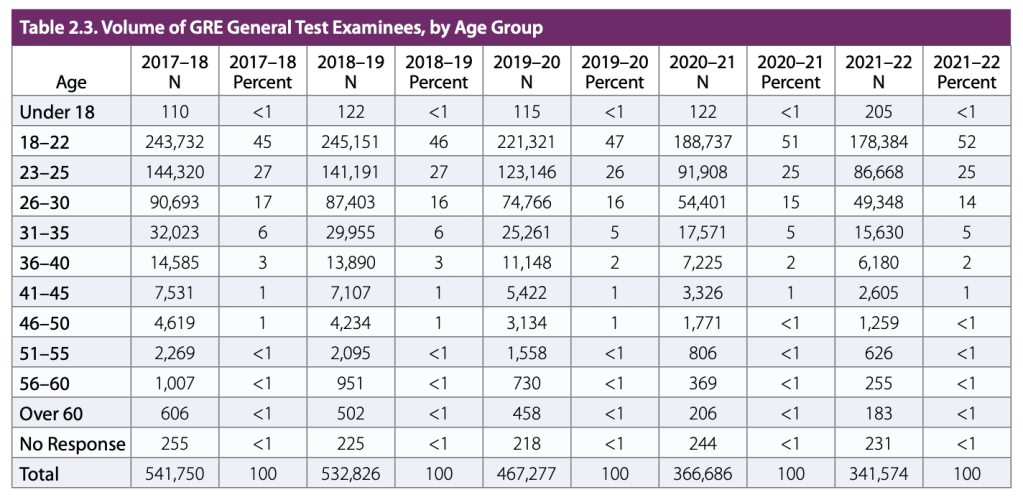
GRE test takers are skewing younger, as people 18-22 taking the GRE has increased from 45% of the total in 2017-18 to 52% in 2021-22. All other test taker cohorts have slowly declined in their percentage of the total.
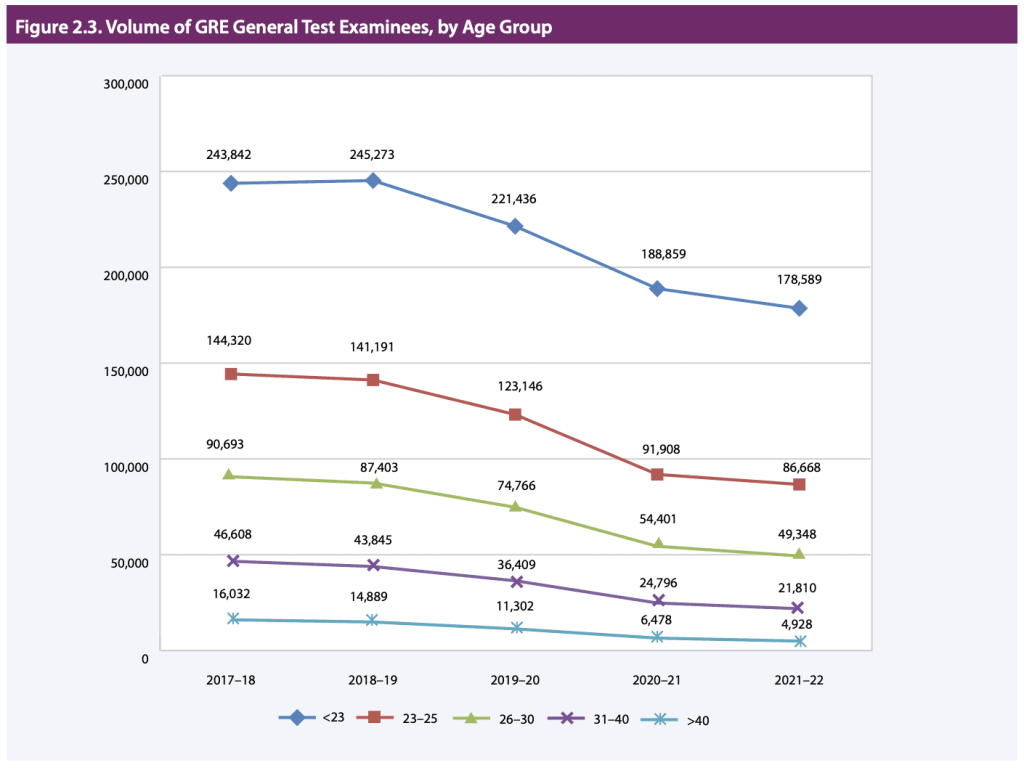
As you can see, the trend lines for each age group follow similar patterns, which shows that the overall composition of GRE test takers age has not changed dramatically in the last five years.
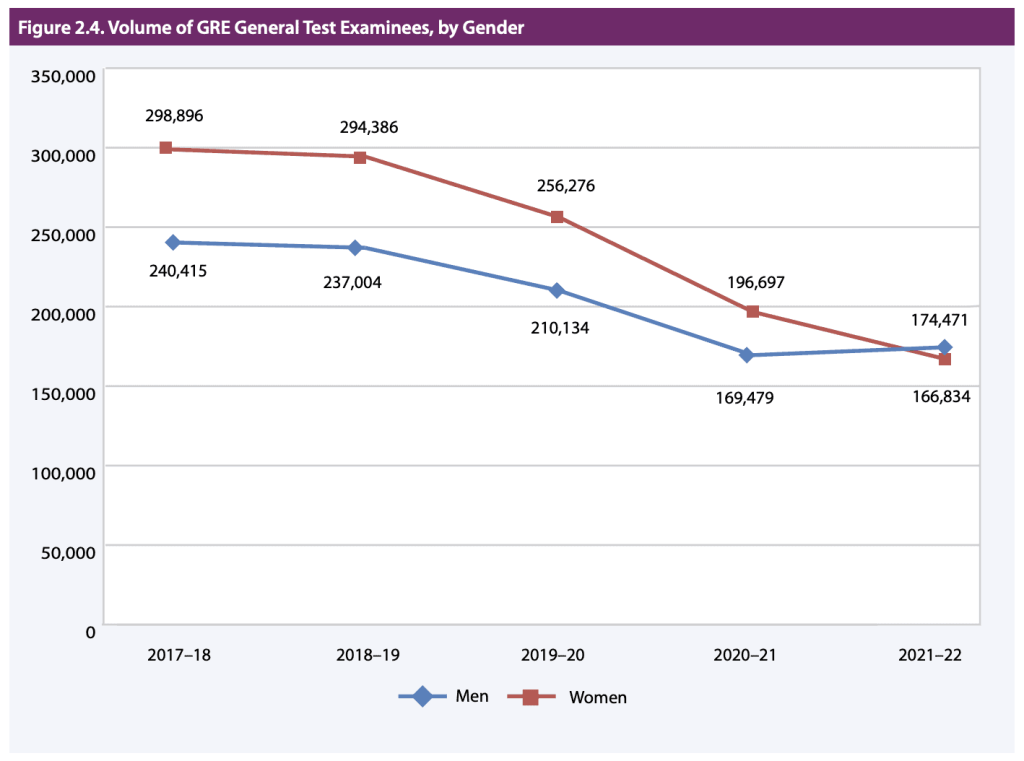
In 2021-22, the number of men taking the GRE was greater than the number of women taking the GRE for the first time in recent years. This change was largely driven by the shift from US Citizens to non-US Citizens, since the US has a predominantly female GRE test taker population, while countries like China and India have a predominantly male GRE test taker population.
Men had slightly higher mean Verbal Reasoning and higher Quantitative Reasoning scores than women, and women had a slightly higher mean Analytical Writing score than men.
A Snapshot of the Individuals Who Took the GRE® General Test, 2022
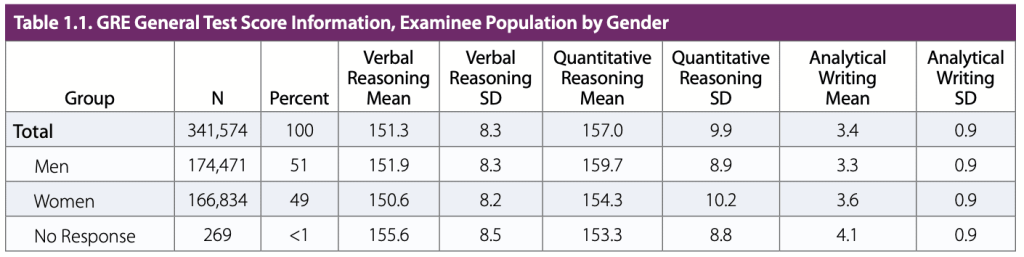
Slightly more men took the GRE than women in 2021-2022 – 51% to 49%. Men outscored women on the GRE Verbal Reasoning and Quantitative Reasoning sections, while women outscored men on the Analytical Writing section.
But when you dig deeper, you can see that there’s actually a big difference when you break out the gender of the test takers by country. Let’s explore that in the next section.
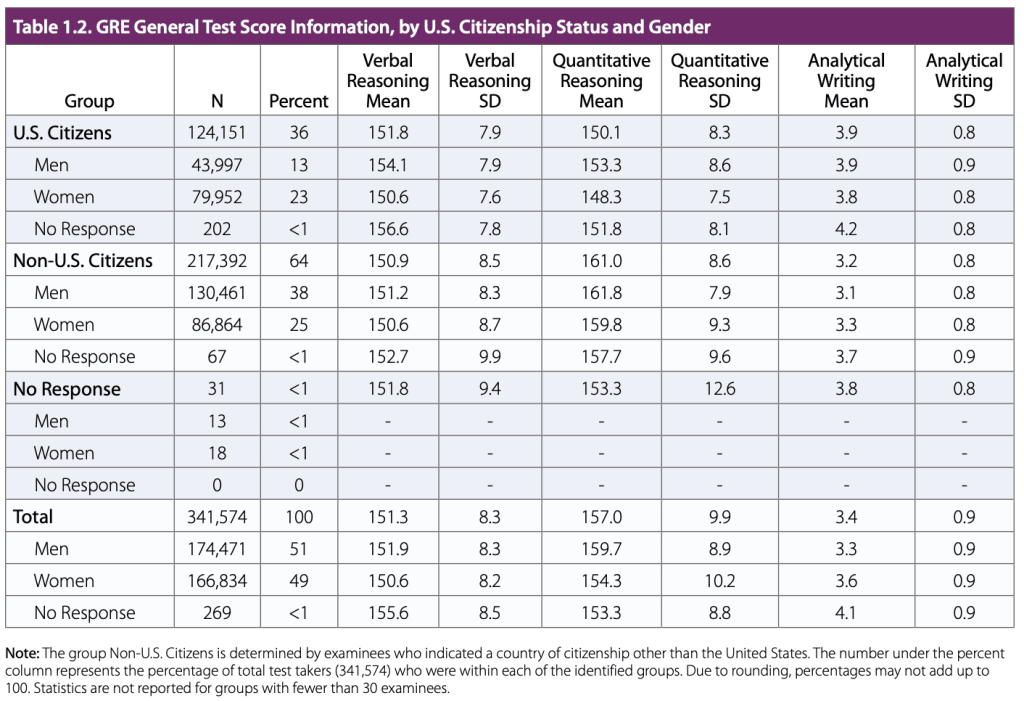
Suddenly these statistics look very different. Among US citizens, far more women took the GRE than men, with 64% of GRE test takers being women and only 36% of GRE test takers being men. This mirrors the recent report from AEI.org that showed that women earned 60% of all master’s degrees in 2020.
Outside of the US, it’s a different story: 60% of GRE test takers outside of the US were men, while only 40% were women.
Also interesting is that the majority of GRE test takers were not US citizens: 64% of GRE test takers were not US citizens, while 36% were US citizens.
Men who were US Citizens scored higher than men who were not US Citizens on the Verbal Reasoning and Analytical Writing sections, but scored substantially lower on the Quantitative Reasoning section.
When compared to women who were US Citizens, women who were not US Citizens scored the same on the Verbal Reasoning section as Non-US Citizen women, lower on the Analytical Writing section, and much higher on the Quantitative Reasoning section.
Taken together, while it is clear that US citizens still enjoy a small advantage in the GRE Verbal Reasoning and Analytical Writing sections, possibly due to them being in their native English language, US citizens are being outperformed dramatically on the GRE Quantitative Reasoning section. This also tells you something about the kind of test takers commonly taking the GRE abroad, who are likely more focused on applying to STEM (science, technology, engineering, and math) programs in the United States.
In the report, ETS includes a breakdown of the number of GRE test takers in each country and what their average scores were. To save you from reading a list of 160+ countries, we’ve pulled out the data for the top twelve by volume below:
| Country | GRE Test takers | Verbal Reasoning Mean | Quantitative Reasoning Mean | Analytical Writing Mean |
|---|---|---|---|---|
| United States | 124,151 | 151.8 | 150.1 | 3.9 |
| India | 114,467 | 150.5 | 161.2 | 3.0 |
| China | 50,758 | 153.4 | 165.9 | 3.4 |
| Nigeria | 4,598 | 149.7 | 151.7 | 3.3 |
| Iran | 4,587 | 149.8 | 161.7 | 3.3 |
| Bangladesh | 3,090 | 145.4 | 155.7 | 3.2 |
| Republic of Korea | 2,853 | 151.9 | 161.9 | 3.5 |
| Pakistan | 2,697 | 148.3 | 152.3 | 3.5 |
| Taiwan | 2,694 | 149.1 | 164.1 | 3.2 |
| Canada | 1,966 | 155.8 | 156.6 | 4.2 |
| Nepal | 1,745 | 146.4 | 156.1 | 3.3 |
| Ghana | 1,441 | 145.9 | 147.8 | 3.3 |
The United States and India have the most GRE test takers by far, with over 110,000 each, and China is third with just over 50,000 GRE test takers. After that, there is a huge gap, with the next country on the list, Nigeria, having 4,596 test takers. Only fourteen countries had more than 1,000 GRE test takers.
India has almost overtaken the US in total GRE test takers, with 114,647 in 2022 to the United States’ 124,151.
Let’s take a quick look at the top three countries. The average GRE Verbal score in the United States was 151.8; the average GRE Verbal score in India was 150.5; and the average GRE verbal score in China was 153.4. This shows the strength of China’s English language education in its most globally mobile students.
The average GRE Quant score in the United States was 150.1; the average GRE Quant score in India was 161.2; and the average GRE Quant score in China was 165.9. This is remarkable: China’s average GRE Quant score is 165.9, just 4.1 points from the maximum score of 170.
Asian MBA applicants had the highest average GRE scores for all three sections: Verbal Reasoning, Quantitative Reasoning, and Analytical Writing.
Key GRE Statistics from the 2022 ETS GRE Snapshot Report, Achievable
The average GRE Analytical Writing score in the United States was 3.9; the average GRE Analytical Writing score in India was 3.0; and the average GRE Analytical Writing sore in China was 3.4. The United States gets the best of this category among these three countries, likely in part due to the fact that English is the native language and its population has more experience writing in English.
China has the highest average GRE Quant score with an average score of 165.9. This is just 4.1 points from the maximum score of 170, and is truly an incredible average score.
American Samoa had the highest average GRE Verbal score with an average score of 161.8. However, they only had 121 GRE test takers, so it is a small sample size. Among the top fourteen countries with over 1,000 GRE test takers, Canada had the highest GRE Verbal score with an average score of 155.8.
Singapore had the highest average GRE Analytical Writing score with an average score of 4.5 out of 6. Close behind was the United Kingdom, who had an average GRE Analytical Writing score of 4.4. Singapore and the UK had 544 and 653 GRE test takers, respectively.
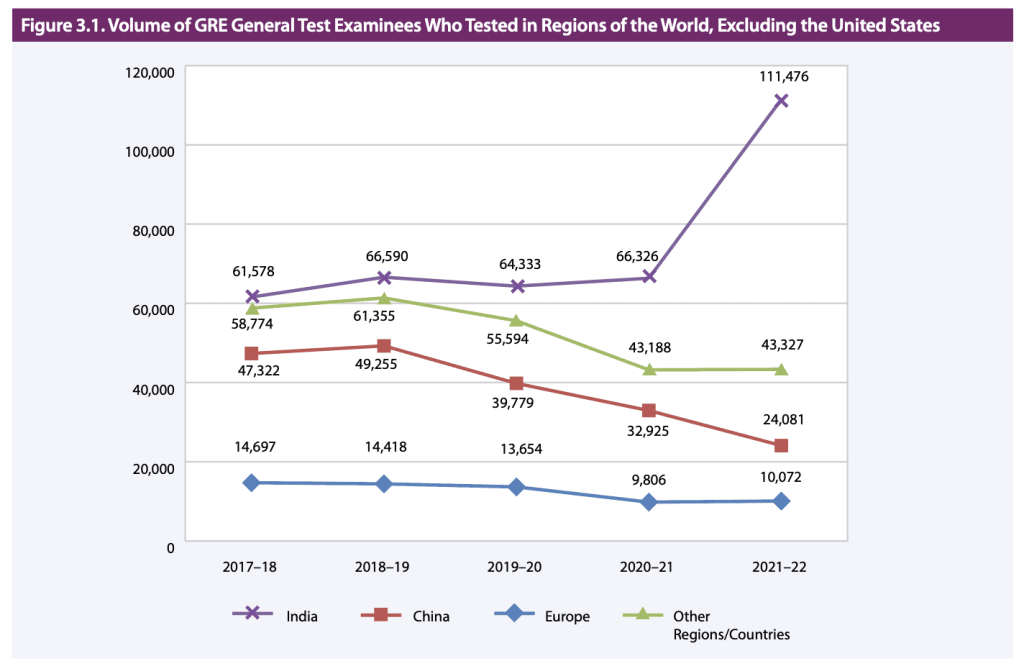

The number of GRE test takers in India increased 68% between 2020-21 and 2021-22. This helped offset the GRE’s decline in other regions, notably the US, which decreased 29% between 2020-21 and 2021-22. Aside from India, the GRE declined in China and the United States in the last year. GRE test takers increased slightly in Europe and in the rest of the world between 2020-21 and 2021-22.
Men who were US Citizens scored higher than men who were not US Citizens on the Verbal Reasoning and Analytical Writing sections, but scored substantially lower on the Quantitative Reasoning section.
Key GRE Statistics from the 2022 ETS GRE Snapshot Report, Achievable
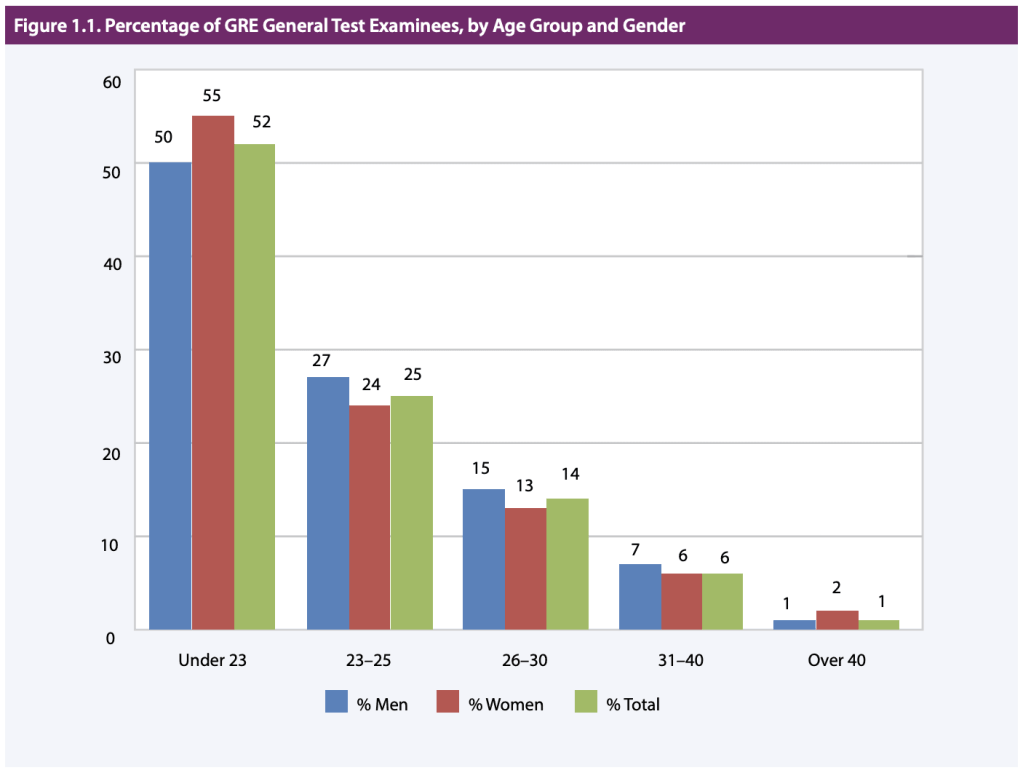
The weighted average age of all GRE test takers is 22 (weighted by the number of test takers). The average age of GRE test takers was the same for men and women.
52% of all GRE test takers were under 23, and an additional 25% of test takers were 23-25. 77% of all GRE test takers were under 25, which shows us that the majority of GRE test takers are studying for the GRE pretty close to when they finish their undergraduate degrees at 22.
For both men and women, younger GRE test takers had higher mean scores the Verbal Reasoning and Quantitative Reasoning measures than older GRE test takers.
A Snapshot of the Individuals Who Took the GRE® General Test, 2022
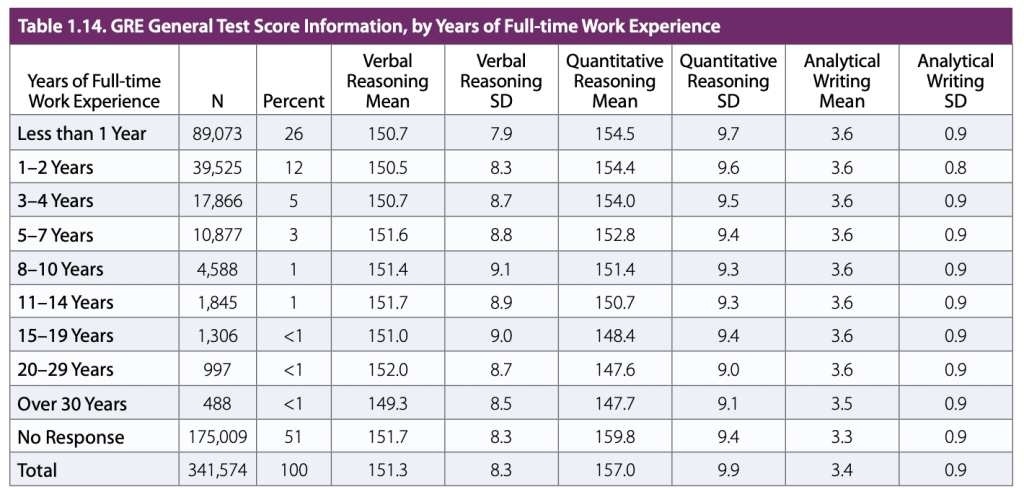
These test takers are likely looking to move into graduate school programs immediately after their undergraduate program or after a short 1-2 year stint in the workforce. This is backed up by the table above, which shows that 52% of respondents had less than 1 year of work experience when taking the GRE, and a total of 66% of GRE test taker respondents had less than 3 years of work experience. Surprisingly, the majority of GRE test takers do not have much work experience.
The remaining 23% of test takers were 26 or older. Just 1% of GRE test takers were over 40, which shows that the window for graduate school seems to close for most after 40 years old.
For this section, we’re going to focus on GRE test takers under 40, since that makes up 99% of all GRE test takers.
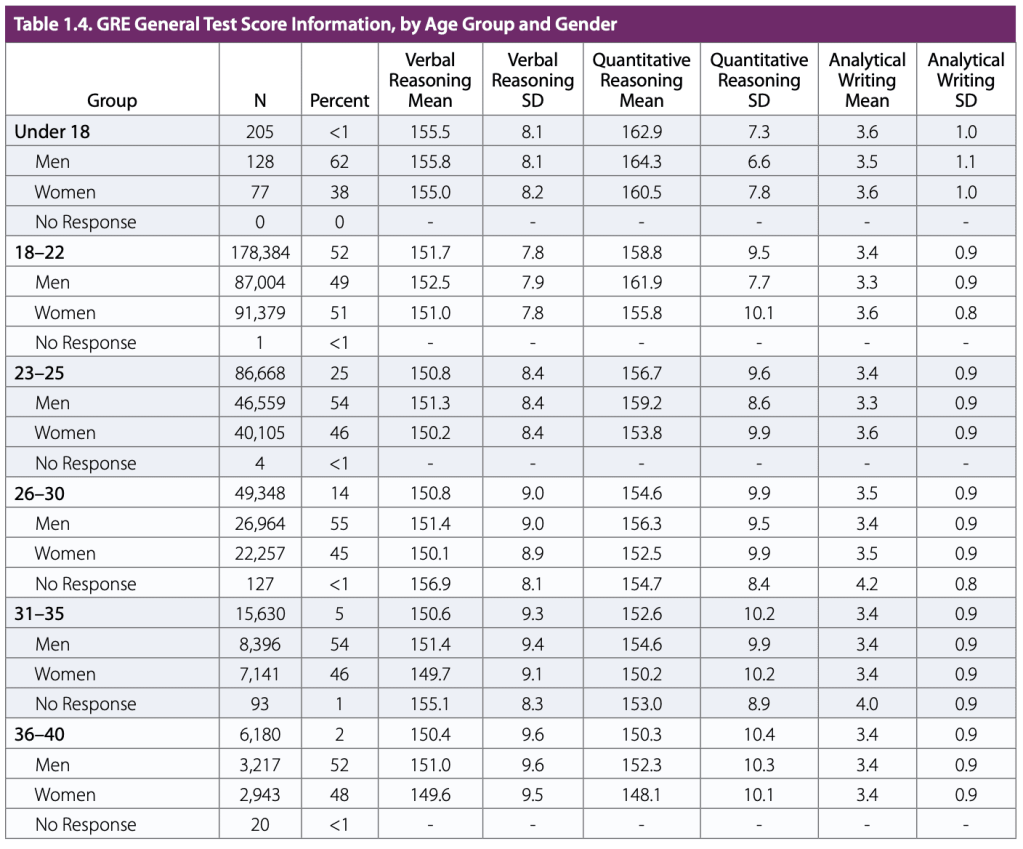
GRE test takers age 18-22 have higher average test scores than all other groups besides the outlier under 18 group. For both men and women, younger GRE test takers had higher mean scores than older GRE test takers. Additionally, the gender performance differences we saw earlier, with men outperforming women on the Verbal Reasoning and Quantitative Reasoning sections, and women outperforming men on the Analytical Writing section, were consistent across all age groups.
The weighted average age of all GRE test takers is 22.
Key GRE Statistics from the 2022 ETS GRE Snapshot Report, Achievable

While many of the majors match the overall trend towards less GRE test takers, there are still some interesting trends here. GRE test takers in Engineering and Physical Sciences have declined the least in the last 5 years, while GRE test takers in Education, Humanities and Arts, and Social and Behavioral Sciences have declined the most as a percentage.
GRE test takers in Education, Humanities and Arts, and Social and Behavioral Sciences have declined the most since 2017, with the decline becoming more pronounced in each field during the COVID-19 pandemic.
Key GRE Statistics from the 2022 ETS GRE Snapshot Report, Achievable
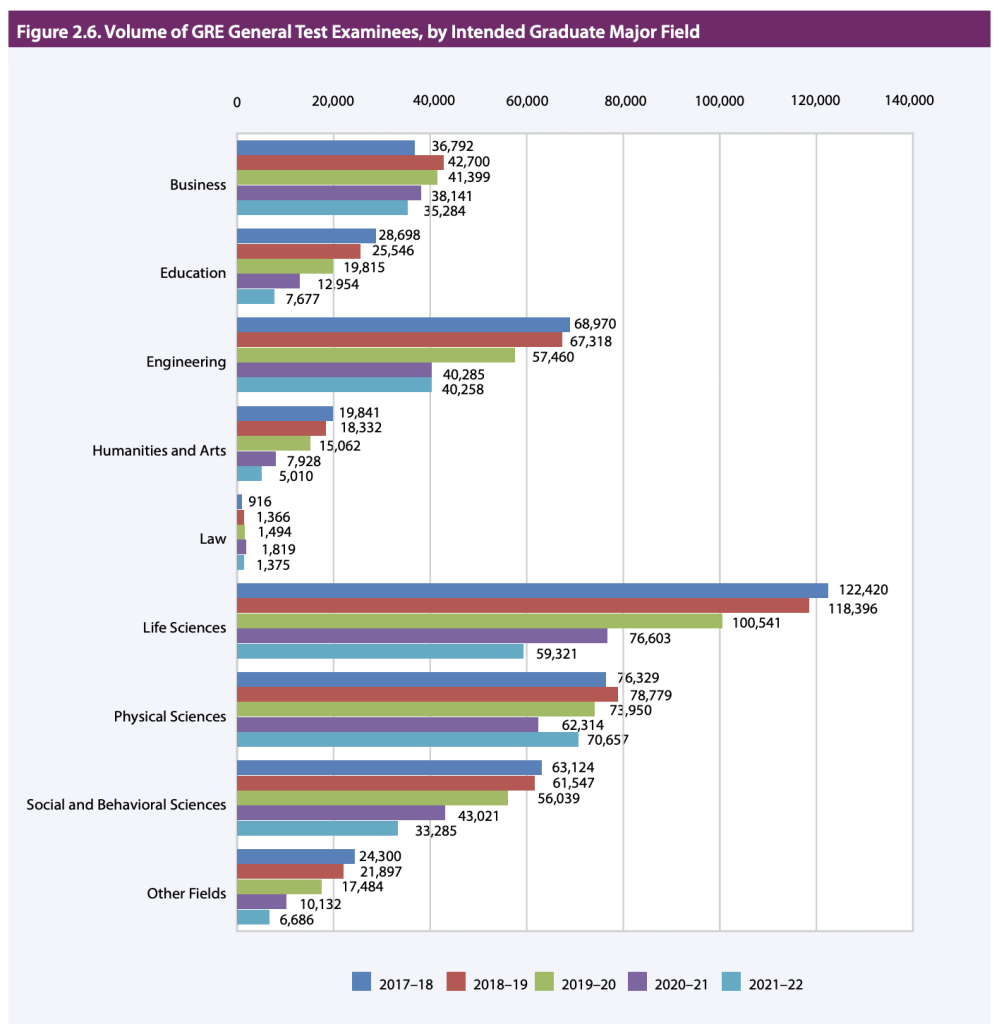
Among intended graduate school majors, Engineering, Business, and Physical Sciences bucked the overall decline in GRE test takers and held steady or grew between 2020-21 and 2021-22. A common theory for why these majors bucked the trend was the shift to test-optional policies among US universities and graduate schools during the COVID-19 pandemic, which was less commonly enacted among STEM programs than others. In fact, that is not the case. Instead, this trend was caused by the growth in GRE test takers from India for each of these three categories, which you can see below.
66% of GRE test taker respondents had less than 3 years of work experience.
Key GRE Statistics from the 2022 ETS GRE Snapshot Report, Achievable

When you factor in the Indian GRE test takers above, it is clear that the primary trend driving the differences in each major’s GRE test taker population over the last five years is whether or not that major is popular among Indian test takers.
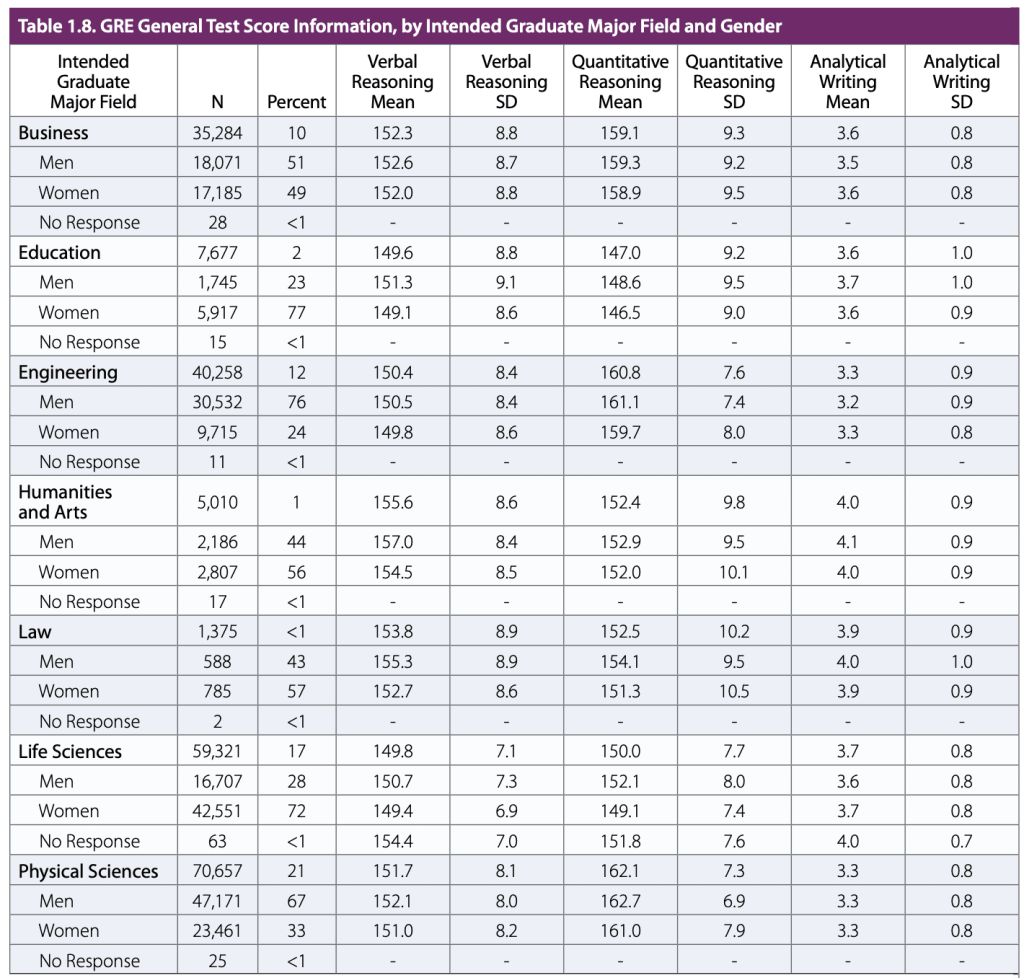

What is a good GRE score by major depends on which major you’re applying for. The intended majors with the highest average GRE Verbal Reasoning scores are Humanities and Social and Behavioral Sciences. The intended majors with the highest average GRE Quantitative Reasoning scores are Business, Engineering, and Physical Sciences. These trends are guided by the types of scores that these programs want to see, as each major will emphasis different skills.
It is clear that the primary trend driving the differences in each major’s GRE test taker population over the last five years is whether or not that major is popular among Indian test takers.
Key GRE Statistics from the 2022 ETS GRE Snapshot Report, Achievable
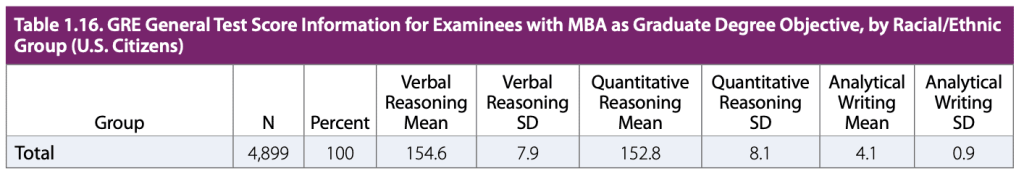
The average GRE score for MBA applicants is 154.6 Verbal Reasoning, 152.8 Quantitative Reasoning, and 4.1 Analytical Writing. Getting higher than these scores will put you in a good position when applying to an average MBA program. Of course, what GRE score you need depends a lot on what MBA program you are applying to, so be sure to look up the median Verbal, Quant, and Writing scores for that program when setting your targets.
The largest cohort of GRE test takers targeting MBA programs is 26-30 with 39% of test takers.
Key GRE Statistics from the 2022 ETS GRE Snapshot Report, Achievable
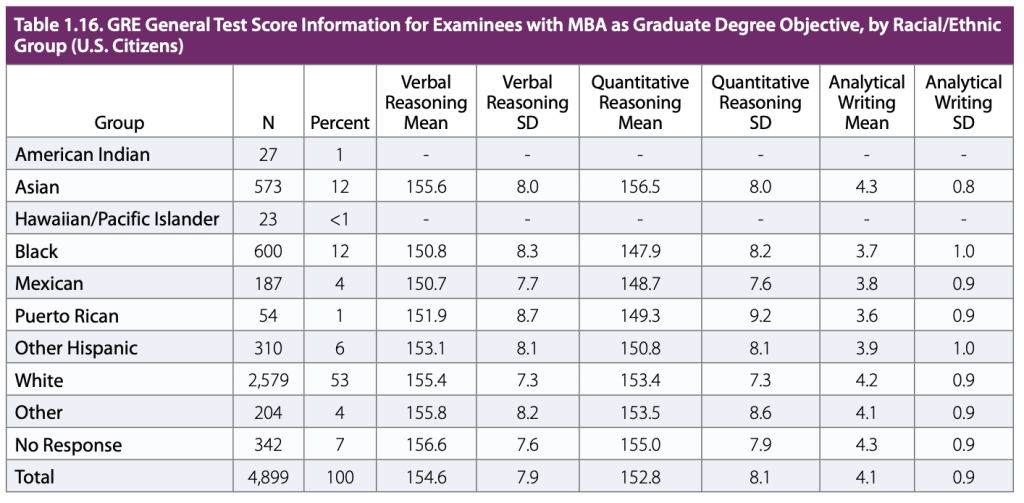
The majority of GRE test takers targeting MBA programs were white, representing 53% of the total population. The next largest ethnic group of GRE test takers targeting MBA programs were black, representing 12%, and Asian, also representing 12% of the total population.
Among the named ethnic groups, Asian MBA applicants had the highest average GRE scores for all three sections: Verbal Reasoning, Quantitative Reasoning, and Analytical Writing.
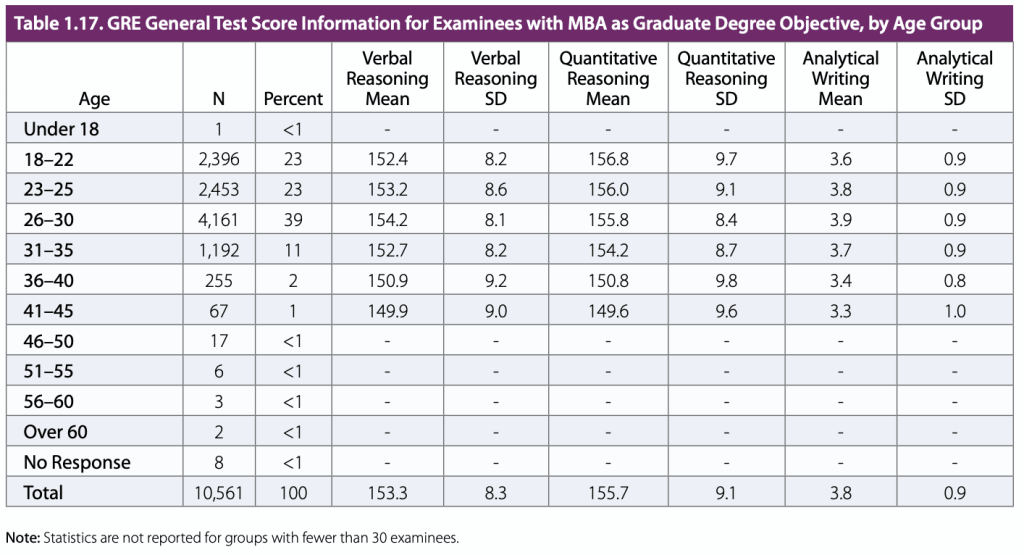
GRE test takers applying to MBA programs skews older than the total GRE test taker audience, with only 46% of test takers under the age of 25 versus 77% for the overall population. The largest cohort of GRE test takers targeting MBA programs is 26-30 with 39% of test takers. Less than 15% of GRE test takers targeting MBA programs are over 30, and less than 4% are over 35.
Among GRE test takers applying to MBA programs, 26-30 year olds had the highest average Verbal Reasoning score and average Analytical Writing score, while 18-22 year olds had the highest average Quantitative Reasoning score.
MBA applicants with more work experience had higher average GRE scores.
Key GRE Statistics from the 2022 ETS GRE Snapshot Report, Achievable
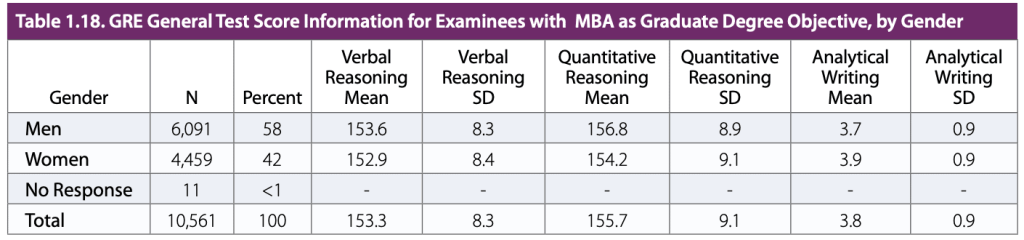
58% of GRE test takers applying to MBA programs were men. This skews more heavily male than the total GRE test taker audience, which is 51% male.
Men applying to MBA programs had higher average scores than woman on the GRE Verbal Reasoning and GRE Quantitative Reasoning sections, while women had higher scores than men on the GRE Analytical Writing section.
Men applying to MBA programs had higher average scores than woman on the GRE Verbal Reasoning and GRE Quantitative Reasoning sections, while women had higher scores than men on the GRE Analytical Writing section.
Key GRE Statistics from the 2022 ETS GRE Snapshot Report, Achievable
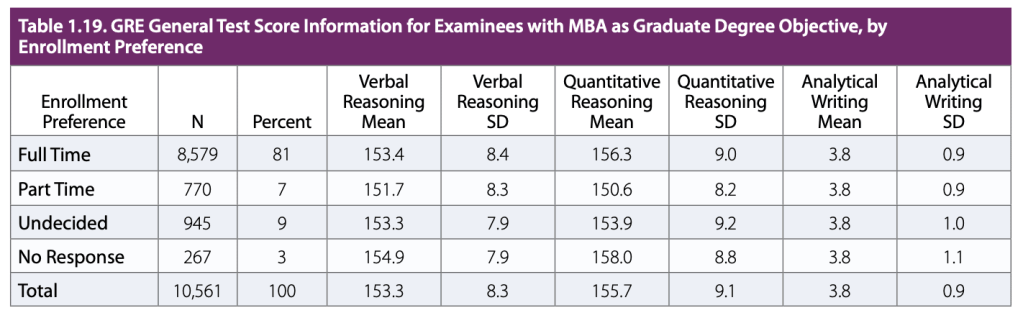
The type of MBA program most popular among GRE test takers was Full Time, with 81% of respondents saying they plan to attend a full time program. Full time programs are still the most popular kind of MBA program enrollment type among GRE test takers.
GRE applicants pursing full time MBA programs had the highest average Verbal Reasoning and Quantitative Reasoning scores.
Among GRE test takers, 73% of 2022 MBA applicants preferred doing their MBA entirely on-campus, up 4% from a year ago.
Key GRE Statistics from the 2022 ETS GRE Snapshot Report, Achievable
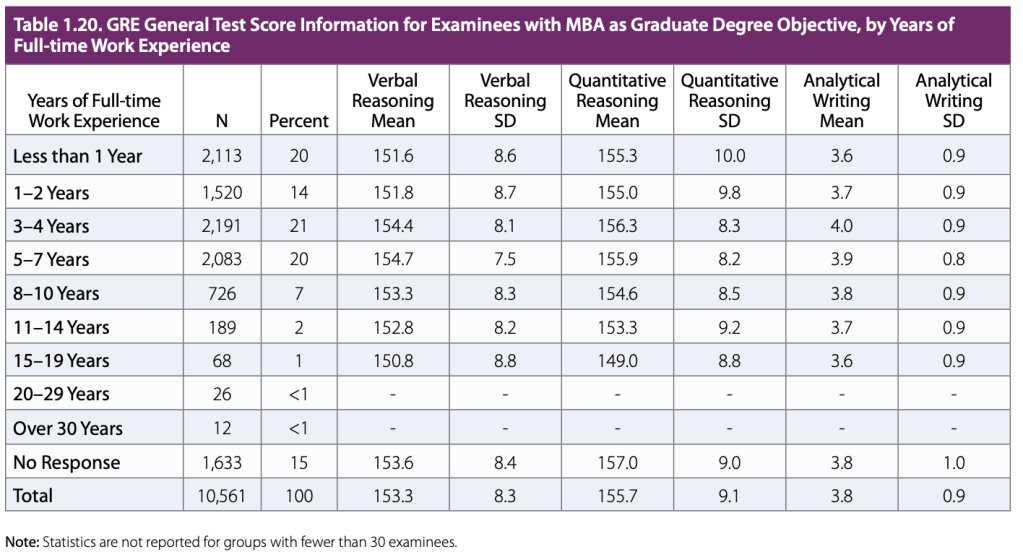
20% of GRE applicants to MBA programs have less than one year of work experience, which shows that they’re applying to business school right after finishing their undergraduate degree. 34% of GRE applicants to MBA programs have less than 3 years of work experience, and 75% of GRE applicants to MBA programs have less than 8 years of work experience.
Except for those with 15 years of work experience or more, MBA applicants with more work experience had higher average GRE scores. MBA applicants with 5-7 years of work experience scored highest on the GRE Verbal Reasoning section, while MBA applicants with 3-4 years of experience scored highest on the GRE Quantitative Reasoning and Analytical Writing sections.

Among GRE test takers, 73% of 2022 MBA applicants preferred doing their MBA entirely on-campus, up 4% from a year ago. An additional 10% of applicants were seeking a combination program that included some on-campus time. Only 4% of GRE test takers applying to MBA programs preferred online-only programs, the smallest cohort. When it comes to MBA programs, it seems that the networking and other benefits of being on-campus still outweigh the convenience of studying online.
GRE test takers applying to on-campus MBA programs had the highest average GRE scores in all sections. GRE test takers applying to online-only MBA programs had the lowest average GRE scores in all sections. It is possible that this is because online-only MBA programs are less selective, or because they target a different audience that generally gets lower GRE scores.
The ETS report A Snapshot of the Individuals Who Took the GRE General Test shows that the makeup of the average GRE test taker is shifting to be more international, particularly from India, and with more Physical Sciences and Engineering majors that ever before – thanks in part to that international shift.
We hope this helps you gain insight into test taker populations and possible key performance drivers of examinees. We also hope that the average GRE scores by country, major, gender, ethnic group, and more helped you learn what your target score should be.