
Statistical process control (SPC) is one of the most effective methods for improving quality and efficiency in manufacturing and service industries. Organizations can detect issues early, cut costs, and maintain consistent performance through applying statistical methods to track fluctuation. The definition of SPC, its history, its instruments, and its benefits and drawbacks are all covered in this article.

Dr. Walter Shewhart of Bell Laboratories first proposed SPC in the 1920s, and Dr. W. Edwards Deming later developed it. Following World War II, Japanese businesses adopted the technique, which contributed to their reputation for superior quality. SPC is being utilized globally in sectors like electronics, food, medicines, and automotive.
SPC aims to differentiate between typical variation in process and anomalous variation that indicates a problem. Early problem identification allows businesses to take action before defects occur.
Statistical process control is a methodology for measuring, monitoring, and controlling variation in processes. There is a degree of variation in every process, whether it be in manufacturing or services. SPC assists organizations in determining if the variation is acceptable or if it indicates a more serious problem that needs to be fixed.
The control chart (Shewhart chart) is the most widely used SPC tool. It is a graph that shows process data in relation to statistical limits:
The lower control limit is the lowest variation expected under normal conditions.
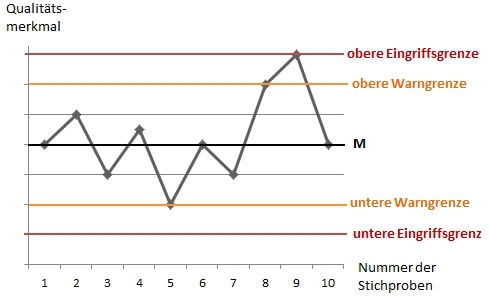
If data points remain within the limits, the process is considered stable. If points fall outside the limits or show unusual patterns, corrective action is required.
This process is repeated continuously to maintain improvements.
In competitive markets, SPC allows organizations to maintain consistent quality while reducing operational waste.
Many companies now use SPC software to automate data collection and analysis. These systems can connect with enterprise platforms, provide real-time monitoring, and issue alerts when variation exceeds limits. Automation allows SPC to scale across large operations and helps organizations comply with regulatory requirements in fields such as healthcare and aerospace.
SPC is often compared to statistical quality control (SQC). While they are related, there is a key distinction.
Statistical process control remains a tested strategy for improving quality, reducing costs, and increasing efficiency. It combines statistical methods with practical tools that allow organizations to identify variation and respond before problems escalate. Although implementation requires investment and training, the long-term benefits are significant.
By using SPC, organizations can achieve stable, predictable processes and build a culture of continuous improvement. In today’s competitive environment, that consistency can be the difference between success and failure.